Enhance Your Monitoring with Prometheus Anomaly Detector

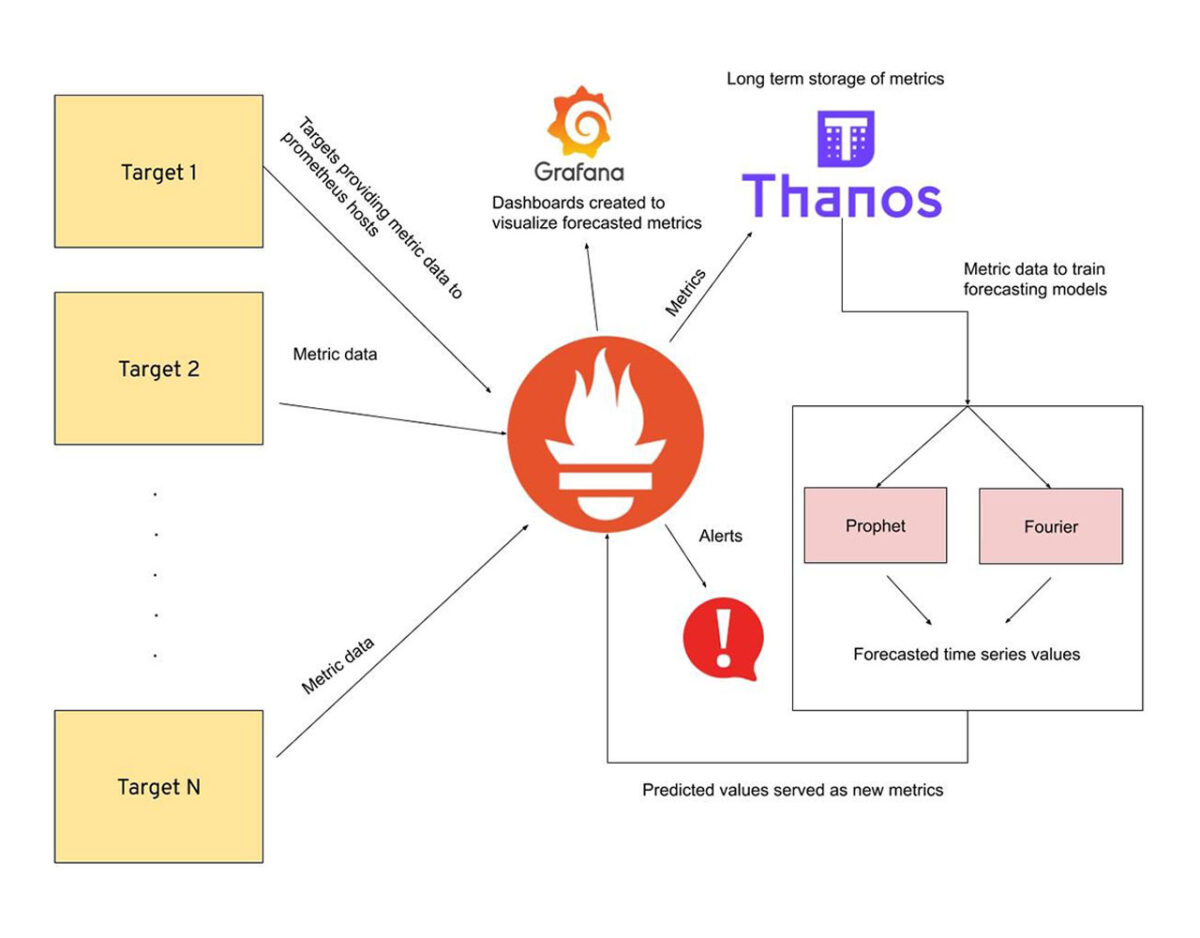
One of the most attractive services to complement your monitoring tools is the Prometheus Anomaly Detector service. This service excels in detecting anomalies based on Prometheus data.
The Benefits of Prometheus Anomaly Detector
You might be wondering about the advantages of using this service. It assists the NOC-DevOps team in intelligently identifying anomalies within the monitoring system, resulting in smart alerts (Smart Alerting) based on the detected data. This capability significantly enhances operational efficiency and responsiveness.
Continuous Monitoring and Flexible Thresholds
Manually checking all graphs and data from the monitoring system is challenging and unsustainable. In contrast, the Prometheus Anomaly Detector continuously monitors system behavior. Fixed threshold alarms are often inadequate for many services. Therefore, this service learns service behaviors and adjusts the anomaly detection intervals flexibly.
Anomalies can include:
- Unusual increases in service requests
- Unexpected resource consumption
- Sharp changes in network traffic
Timely Detection for Improved Performance
Timely detection and notification of anomalies can significantly reduce problem resolution time and improve the technical team’s performance during incidents.
Easy Setup and Management
You can access the project source at GitHub. We have provided a Docker-Compose file for easy setup and management. All environment variables are thoroughly explained in the project’s GitHub repository. Additionally, a comprehensive description of the data processing model is available.
version: "3.1"

services:

    pad:

      image: quay.io/aicoe/prometheus-anomaly-detector:latest

      ports:

        - 8080:8080

      environment:

        FLT_PROM_URL: "http://prometheus"

        FLT_RETRAINING_INTERVAL_MINUTES: 1

        FLT_METRICS_LIST: 'example promql query'

        APP_FILE: "app.py"

        FLT_DATA_START_TIME: "3d"

        FLT_ROLLING_TRAINING_WINDOW_SIZE: "15d"
Important Installation and Operation Points
- Resource Usage: This service is CPU-intensive. We have made code changes to optimize resource usage. Once these changes are complete, they will be committed to the main source.
- Data Training: To train the necessary data, provide a PromQL Query to the service. Heavy queries should first be converted into a new time series using the Recording Rule before being used.
groups:

  - name: example

    rules:

    - record: job:http_inprogress_requests:sum

expr: sum by (job) (http_inprogress_requests)- Smart Alarms: You can set alarms based on detected anomalies or the percentage change in the yhat_upper – yhat_lower ratio relative to your main data.
- alert: transaction-anomaly
expr: avg(transactions:rate5m) / avg(transactions:rate5m_prophet{value_type="yhat"}) * 100 - 100 > 10 or transactions:rate5m_prophet{value_type="anomaly"} == 1
for: 10s
labels:
severity: page
annotations:
summary: " an anomaly detected on database transactions "
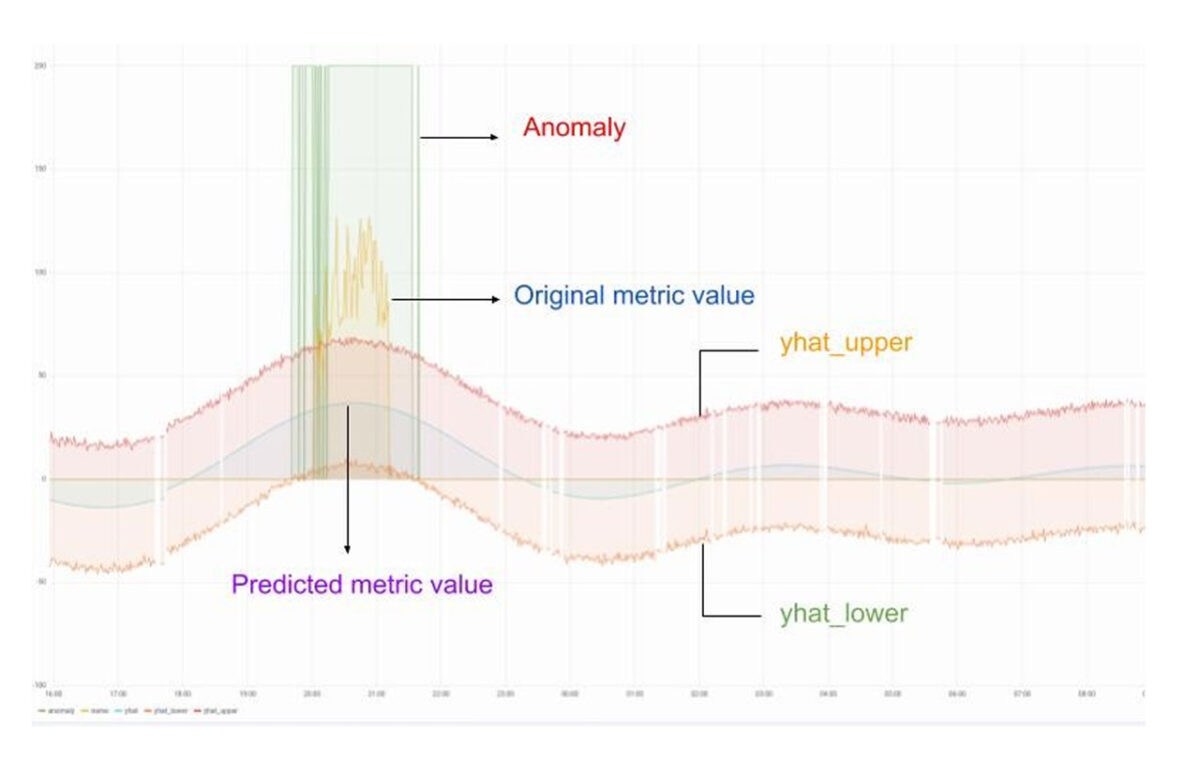
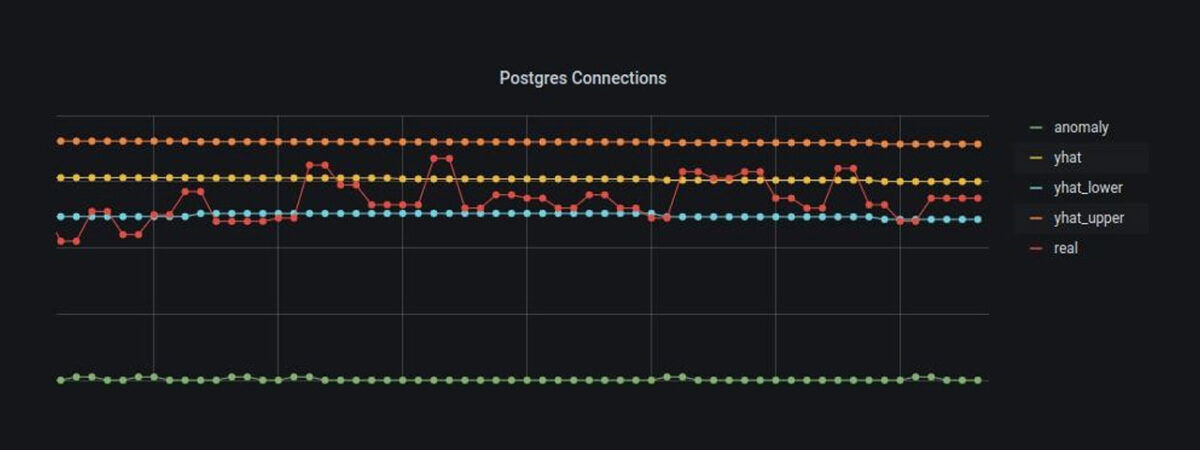
message: " transaction on the database is {{$value}}% upper than normal value "These smart alarms notify you of ongoing anomalies. For dashboard creation, it is advisable to display both the main data and the anomaly detection data. This approach allows for assessing the reliability and accuracy of predicted values and monitoring how the system’s current behavior aligns with the expected range.
Expanding the Scope
AI specialists and colleagues can further enhance this topic. Many organizations have achieved significant success in this area and developed similar products. The concept of Anomaly Detection and AI in DevOps tools, especially Monitoring, is extensive, offering many features beyond those covered by this service.
By leveraging the Prometheus Anomaly Detector, you can elevate your monitoring capabilities, ensuring proactive incident management and optimized system performance.